
By Paul Glance PhD, Glance Financial Advisors LLC
Paul will be presenting at Hedge Connection’s Deal Ring event in Chicago on June 27th.
As widely reported in the financial media and by S&P Global, over the past 15 years, 92.2% of large-cap funds have failed to beat the S&P 500. Or in other words, a random selection of a portfolio consisting of large-cap funds will result in only a 7.8% probability of beating the S&P 500 over a long time period. The Standard & Poor’s 500, often abbreviated as the S&P 500, is an American stock market index based on the market capitalizations of 500 large companies having common stock listed on the NYSE or NASDAQ. It is one of the most commonly followed equity indices, and many consider it one of the best representations of the U.S. stock market, and a bellwether for the U.S. economy.
The S&P 500 index acts similar to an actively managed fund in that poor performing stocks are removed and replaced quarterly by good-performing stocks. All good performing stocks, to be added to the index, must have at least four consecutive quarters of positive earnings. These filter criteria and the active management feature explains, in part, why this index is difficult to beat.
The quarterly rebalancing also makes it difficult to quantitatively model the index since its underlying fundamental metrics (such as earnings, and earnings growth) undergo a discontinuous “jump up” by a random amount four times a year. Price is constrained to remain continuous during the rebalancing calculation and does not undergo a random discontinuous step increase. This constrained price feature is necessary but can be misleading to the chart analysts since it hides the fact that the daily plot of price does not indicate that the fundamental underlining metrics are being periodically and always improved by a random step increase four times a year which in turn increases the price momentum. It is also difficult to include the rebalancing effect in a back-test study of the S&P 500.
Several years ago, I visited the Millennium Fund and I will always remember a quote from the founder, Izzy Englander, “no one trading system works all the time”. For that reason, most funds diversify their investments over several independent trading systems and several independent sectors. However, over-diversification can lead to only average performance. One solution for obtaining better performance is to not randomly select funds; rather select a diverse portfolio consisting of the best available professional strategies posted on third-party ranking sites such as Morningstar and TimerTrac.com.
Most professional investors know that for any strategy, past performance is not a guarantee of future performance. In fact, S&P Global found that there’s a stronger likelihood that a top performing fund will become one of the worst performers in a subsequent period than that it will stay a top performer. However, for a diverse portfolio of several of the best strategies, the average portfolio past performance has a good chance of being replicated into the future even when one strategy stops working.
By actively selecting a diverse portfolio consisting of the top percentile of the best outstanding professional strategies, it should be possible to consistently beat the S&P 500 return and also beat the S&P 500 maximum drawdown. Nevertheless, there is a pool of outstanding professional strategies available to Investors which can be found on web ranking sites.
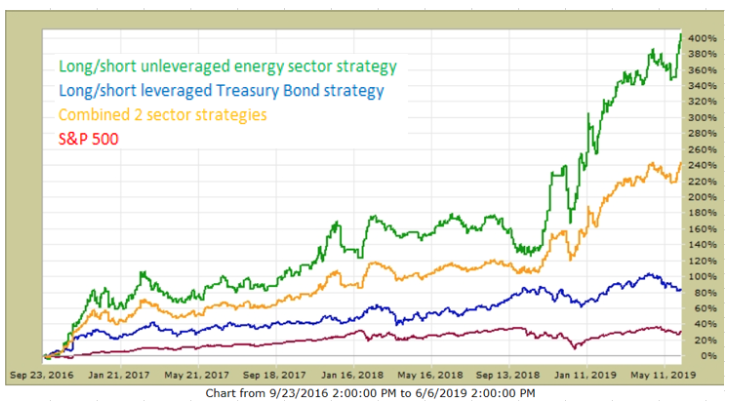
The following chart shows the S&P 500 vs. a long/short unleveraged energy sector strategy, a long/short leveraged Treasury Bond strategy, and a portfolio combining both of the above sector strategies. All three strategies have consistently outperformed the performance of the S&P 500 over the past 32 months with approximately the same maximum drawdown.
For those investors who are brave enough to try to develop their own original trading system, the above discussion serves as a reminder of the difficulty in beating the performance of the S&P 500 benchmark.
Past performance is no guarantee of future results. Inherent in any investment is the potential for loss. This material is being provided for informational purposes only and nothing herein constitutes investment, legal, accounting or tax advice, or a recommendation to buy, sell or hold a security. No recommendation or advice is being given as to whether any investment is suitable for a particular investor. It should not be assumed that any investments in securities, companies, sectors or markets identified and described were or will be profitable. All information is current as of the date of herein and is subject to change without notice. Any views or opinions expressed may not reflect those of the firm as a whole.
About the Author
Paul Glance, President of Glance Financial Advisors, LLC, has a Ph.D. in Mechanical Engineering from Michigan State University. His specialty is computer simulation of dynamic impact events and simulation of financial quantitative strategies. In 1992 he finished in second place in the USA Today national stock contest which was the starting point for his financial career as a sub-advisor to Wealth Management firms and funds. He currently provides trade signals to several wealth management firms. His energy sector strategy is ranked in overall first place over the past 2.7 years.

Vinay Nair
Looking at managers’ overall record last year versus the broader S&P 1500 Composite, 2018 was the fourth-worst year for stock managers since 2001. Thanks for great info.