
Contributed by Dmitrijs Soha, head of Asset Management at Pinnacle Global Alpha
Market outlook
We believe that the US stock market is currently in the middle of a severe price bubble revolving around Software-As-A-Service (SaaS) companies. A good number of these trade at valuations upwards of Price to Revenue of 20 while being loss making all through their existence, minting shares and distributing a portion amongst employees and management as stock – based compensation, and issuing debt to simply stay afloat and continue posting revenue growth.
We believe the main asset these companies have is investor hype and belief in the “disruption” and perpetual growth stories that management and tech talking heads are relentlessly peddling all over the media.
As virtually all of these companies operate in highly competitive industries with low entry barriers and face competition from established tech giants flush with cash and best human capital, we believe most of them will never live up to their valuations. All it takes for them to crash and burn is the hype to cool as growth slows or guidance is lowered, something that is, to our minds, bound to happen within next 3 or so years.
Our short book is chock full of companies like that, but Shopify is close to the top of the list both by the craziness of its relative valuation (current Price to Revenue north of 30) and dubiousness of its business.
Summary
We believe Shopify is a cash flow negative, share-minting business facing severe competition operating in the cyclical industry and having highly questionable revenue streams, all the while priced to an unattainable scenario of high margin market domination and perfect execution.
It is only a matter of time that the company will eventually lose investor confidence and the result would be a massive collapse of the stock price. We do not think that there are grounds for a bankruptcy case as the balance sheet is solid due recent capital raising activities of the company.
Shopify was initially created and built around a great idea of riding the wave of rapid digitalization of the retail industry by offering an elegant bundled turnkey solution to established and emerging online merchants, fostering competition and free flow of goods worldwide.
It is, however, evident that Shopify has deviated from that noble idea somewhere along the way. We think it all started out with certain people figuring out a way to abuse the system to feed off the naivety of others, and the management gradually getting drawn into the vortex of condoning and actually accommodating such practices with the goal of pleasing shareholders and, possibly, capturing monetary benefits for themselves in the process.
We and a number of other trustworthy researchers (kindly see the Related research section for more details on the materials we used) believe that the company is exhibiting a number of alarming aspects indicating to a high degree of certainty that its business is on thin ice and is positioned for an inevitable “crash and burn” scenario, all the while still being priced to eternal growth and perfect execution.
The following are key points outlining our and other researchers’ findings on Shopify that we believe are good food for thought:
- The company had been growing revenues aggressively at 84% p.a. over the last 6 years, while managing to stay free cash flow negative since 2013, compounding those negative cash flows at circa 55% p.a.
- Stock – based compensation schemes have been averaging at 5% of revenues and compounding at a pace of circa 133% p.a. The 2018 figure is almost 3 times the CFO and 10% of Revenue, and the company would have shown a negative cumulative 6-year CFO of circa $133 million if it were adjusted for such transactions.
- Low – margin merchant solutions revenue growth seems to significantly outpace that of the high – margin subscription segment, posting 58% vs 40% respectively, according to the latest quarterly report.
- The company’s gross margin has dropped from 74% in 2013 to a current level of 56%, most probably courtesy of the above.
- The company had been issuing shares aggressively, with its share capital increasing almost 450 times since 2013. Their current cash balance of circa $2 billion is enough to sustain them for the foreseeable future.
- SG&A expenses had been compounding at 75% p.a. while averaging at 47% or revenues, with circa 77% of those being marketing expenses. It is evident by means of simple calculations that spending on marketing is fast becoming quite a waste of capital, with efficiency in attracting monthly recurring revenues (MRR) dropping 2 times since 2017.
- It is highly likely that the management is acutely aware of the above problem, and that might be the reason why their marketing expenses have steadily increased from 67.4% in Q2 2016 to 75.6% in Q1 2018 as a percentage of subscription revenues. We believe they are trying to solve the efficiency problem by simply outspending it.
- The company stopped reporting its key metric of assessing own performance, monthly billings retention rate, in 2018. The metric had been designed by the company with an idea to show the stability of the customer base, but, in our view, it failed to do so. As the company never discloses its actual customer churn rate, some researchers suggest it to be at 77% p.a., implying that only 23% of merchants survive through their first year of operations.
- Shopify’s ”adjusted annual dollar retention rate”, which shows by how much the revenue extracted from a given cohort of customers has grown over a period of time, is close to 48%, according to one of the researchers who bases this number on a model with optimistic assumptions, since Shopify is one of the few companies not reporting it directly. There are no SaaS companies on the Pacific Crest list with dollar retention rates below 80%, virtually all of them are trading at comparables multiple times below Shopify.
- The company does not disclose a breakdown of its revenues by merchant/subscription type, and this has led to a number of researchers claiming that the actual number of steady paying customers is actually much smaller than one might expect. There is evidence from multiple sources that Shopify’s impressive revenue growth is obtained by acquiring large numbers of low quality merchants, or dropshippers, who could compose a vast majority of its customers and have the following distinct traits:
- The overwhelming majority exist for less than a year and then leave the platform, contributing to the high churn rate;
- About 80% of them lose money eventually;
- They do not hold any meaningful inventory;
- Their business model is simple – receive money from a customer, order a desired item from the cheapest online store (usually AliExpress), and let them ship it directly to the end customer.
- By analyzing domains and traffic of websites hosted by Shopify, some researchers have found the following:
- Circa 60% of these websites are less than 1 year old, with estimated over 1 000 domains churning off daily.
- Days to churn seem to vary greatly by domain registrar, with Tucows’ number being about half of the average and almost 3 times lower than that for GoDaddy. It had been suggested that customers registering their domains via the Shopify website (which uses Tucows) are much more likely to be dropshippers lured in by promises of making a quick buck by the company’s extensive advertising, as this is the easiest and quickest way to start.
- There seems to be a clear trend of Tucows overtaking other registrars with its current share of domains at 55%, possibly speaking to the deteriorating quality of Shopify’s merchants.
- Only circa 20% of all of the domains hosted by Shopify show any traffic whatsoever, with top 250 of them capturing about 19% of the total traffic of all Shopify stores. The average store has 799 visits per month while the median store has zero. Out of those 20% with any traffic, only about a thousand have more than 100 000 monthly visits.
- By analyzing top 250 most visited stores, it was identified that around 12% of them have suspicious patterns of traffic growing exponentially to hundreds of thousands and, in some cases, millions of visits per month over very short periods of time.
- Researchers claim that these 12% are all dropshippers reselling products from China, as they all have Trust Pilot ratings of 2 and below, with lots of users reporting they have not received their ordered and paid-for products.
- It is well known that Facebook started to crack down on dishonest merchants as it introduced a system that allows users to rate their experience with the seller and eventually bans merchants with objectively bad reviews. An analysis of traffic patterns and Trust Pilot ratings shows that circa 50% of total Shopify store traffic could be at risk when Facebook actually starts cleaning up its ad feeds, having a possibly devastating effect on Shopify’s GMV and revenues.
- Shopify Capital service, essentially cash loans to merchants at elevated APRs, is currently experiencing significant growth, as volume of loans outstanding grew by circa 16% over just the first quarter of 2019, reaching a total of $107 million. Assuming a double – digit APR and given the above fears on the quality of Shopify’s customers, we believe it would be safe to assume that these loans are of substandard quality and it is therefore worth watching this metric closely, as we expect this business line could grow significantly.
- The Shopify Plus service, a premium subscription tailored to larger merchants priced at $2 000/month + 0.25% of revenue (with a $40 000 cap), had circa 5 300 customers as of December 2018, a miniscule 0.65% of the total reported number of merchants on its platform. We believe it is fair to assume that the variable part accounts for a significant part of the Shopify Plus MRR, and, as previously stated, it is at a serious risk of being purged by Facebook in its clean up crusade.
Our target price
We will show that Shopify should still be valued at circa 65% below its current market price even if it manages to do the following:
- Become free cash flow positive next year and eventually expand its FCFF margin to 10% over the next 11 years;
- Reach a staggering $477 billion in GMV by 2029;
- Employ circa 4 million merchants on its platform by 2029;
- Grow its total revenues at 25% p.a. over the next 11 years and then at 6% indefinitely.
All of the above should be achieved in the face of stiffening competition from a multitude of large cash – rich peers, some of whom are concurrently Shopify’s main distribution channels employing hostile tactics of cleaning up their ad feeds, possible degradation of customer base, and increasing charge offs on substandard Shopify Capital loans.
Given the above is highly unlikely, we believe that the stock is a good short for a fundamental investor willing to wait for about 3 years withstanding possible upside volatility due to current market sentiment and established price trend.
Our safe bet target price for the short position is circa 110$, a potential 65% profit from the current market price.
Business description
This section of our report is an edited excerpt from the company’s annual report for the fiscal year 2018 available here: https://investors.shopify.com/financial-reports/default.aspx.
Shopify is a cloud-based, multi-channel commerce platform that builds web and mobile – based software and lets merchants set up online storefronts with retail functionality. Merchants use the company’s software to run their business across all of their sales channels, including web and mobile storefronts, physical retail locations, social media storefronts, and marketplaces.
The platform is integrated with leading marketplaces and social media companies such as Amazon, eBay, Facebook, Instagram, Twitter, and Pinterest, providing merchants with a single view of their business and customers across all of their sales channels and enabling them to manage all key aspects of their business from one integrated back office.
The company’s sources of revenue are subscription solutions and merchant solutions. The company principally generates subscription solutions revenue through the sale of subscriptions to the platform, with additional revenues generated from the sale of themes and apps, the registration of domain names, and the collection of variable platform fees.
Merchant solution revenue is generated by providing additional services to merchants to increase their use of the platform. The majority of that revenue is from fees earned from merchants based on their customer orders processed through Shopify Payments. The company also earns on Shopify Shipping, Shopify Capital, other transaction services and referral fees, as well as from the sale of Point-of-Sale (POS) hardware.
The company reports the total number of merchants on its platform to be circa 820 000 as of December 2018, a 34.6% increase from 2017. Large well – known brands such as Nestle, Zippo, LeSportsac, Universal, Nike, UGG, Monster Electronics, Vega, and Colgate-Palmolive all use the company’s services in their marketing and distribution efforts.
Historical fundamentals
Shopify had been growing revenues aggressively at 84% p.a. over the last 6 years, while managing to stay free cash flow negative since 2013, compounding those negative cash flows at circa 55% p.a.
Stock – based compensation schemes have always been an important factor of artificially boosting cash flows, averaging at 5% of revenues and compounding at a stunning pace of circa 133% p.a. The 2018 figure is almost 3 times the CFO, the most current 12 – month rolling figure is circa 9% of the revenue, with significant acceleration of the schemes evident from 2016. By any means, non – cash compensation is a big thing for the company, for it would have shown a negative cumulative 6-year CFO of circa $133 million if it were adjusted for such transactions.
The company had also been issuing shares aggressively, with its share capital increasing almost 450 times since 2013. It is evident that issuing shares had been the most important source of capital for the company since its IPO, for its balance sheet would have been terrible if not for the constant inflow of cash from SPOs. It is worth noting that their current cash balance of circa $2 billion is enough to sustain them for the foreseeable future.
It should be noted that SG&A expenses had been growing exponentially as well, compounding at 75% p.a. and averaging at 47% or revenues, with circa 77% of those being marketing expenses. In order to gauge the effectiveness of these relatively large expenses, we can look at an increase in monthly recurring revenue (MRR) versus an increase in marketing expenses over a sufficiently long period.
The company considers monthly recurring revenues (MRR) to be a key metric in measuring own performance and calculates it at the end of each period by multiplying the number of merchants who have subscription plans at the period end date by the average monthly subscription plan fee, assuming they maintain their subscription plans the following month.
They have increased marketing expenses by circa 53% from 2014 to 2015 ($45.9 million vs $70.4 million), increasing the corresponding MRRs by circa 71% ($6.6 million in 2014 vs $11.3 million in 2015). In 2018, they have increased marketing expenses by circa 53% ($226 million in 2017 vs $346 million in 2018) only to see corresponding MRRs grow at circa 37% ($29.85 million in 2017 vs $40.9 million), a clear drop in efficiency of circa 2 times.
Since such a metric does not show the quality of Shopify’s revenue as it cannot be used to estimate the average life of a new customer, researchers had to speculate and suggest that this number is actually quite low with circa 77% of newcomers not surviving their first year. The average lifetime of a customer is estimated to be about 16 months, when a typical SaaS company should have circa 10% annual churn rate, according to RedPoint Ventures.
Low – margin merchant solutions revenue growth has significantly outpaced that of high – margin subscription revenue, posting 58% and 40% respectively, according to the Q1 2019 report. Gross profit margin on merchant solutions has fallen from 41% in 2018 to 37.7% in Q1 2019, while margin on subscriptions has increased to 80% from 77%. Total Gross profit margin has decreased to 56.3% from 57.8% for the same period.
Retail e-commerce market trends and competition
The retail e-commerce market is a vibrant one, experiencing double – digit growth rates as it becomes increasingly easy for small merchants to enter the space utilizing social media platforms as a one – stop solution for marketing and distribution, with larger players increasingly moving their operations online and increasing their penetration rates as well. The below chart depicts an estimate of total e-commerce sales in $ billions.
Exhibit 3
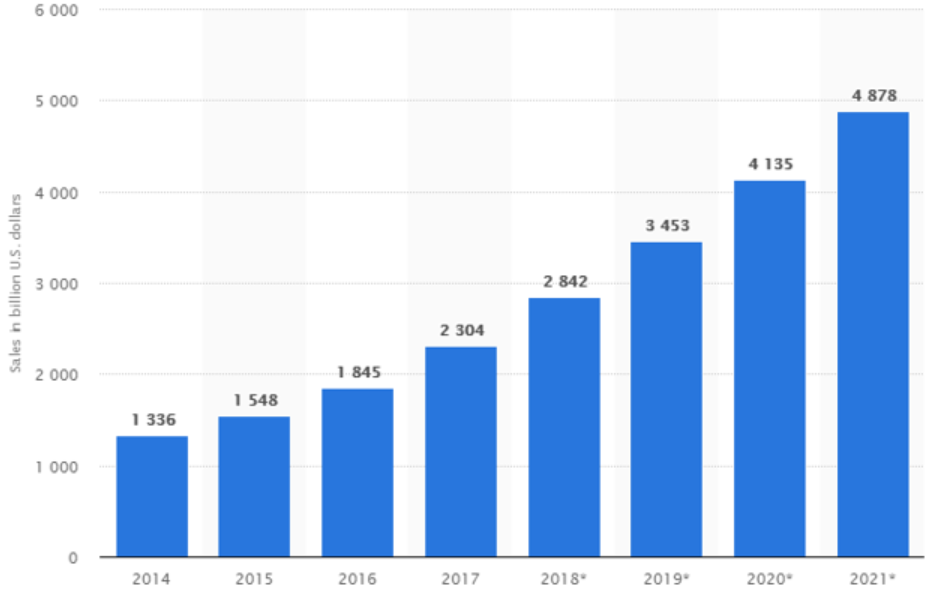
*Source – Statista
The industry is, however, highly competitive with high rate of investments into innovation and marketing. It seems that it is quite easy to enter this space, but very difficult to survive for any meaningful period, as your competitors would be stepping on your toes relentlessly. We expect to see every single major brick and mortar retailer to have a significant online presence within next 3 years, adding to the already heated competition in this space, having significant impact on companies like Shopify.
While the company has a number of direct competitors, such as Adobe with its Magento platform, Wix.com, Square with it recent purchase of Weebly, and SalesForce, we have added a number of other SaaS companies into the mix to illustrate key comparables.
Exhibit 4

*All data from company’s financial statements and Bloomberg
There are a number of bigger companies reaching for their piece of the pie as well, some of them being Microsoft, Facebook, Apple, and Alibaba. Some of the best-known competitors from the private space are BigCommerce, Volusion, and Squarespace.
While the above table clearly shows that the SaaS industry is currently valued at overly generous multiples with virtually all of the companies exploiting that by employing significant stock – based compensation schemes, a few things are apparent when looking at Shopify:
- It is trading at an EV/Sales 2.2 times above sample average and EV/CFO 16 times above sample average.
- Its CFO margin is 9 times below sample average, and would be negative adjusted for stock based compensation.
- It has the second lowest Gross margin, which is 23% below sample average.
- Its Price to book and stock – based compensation levels seem to be in line with elevated sample averages.
In would be an understatement to say that Shopify is operating in a highly competitive environment with a number of strong players with diversified revenue streams, extensive experience, vast financial and human resources, and strong brands already competing or planning to enter the space within a couple of years.
Valuation
We believe Shopify offers a valuable and convenient service to a certain part of its clients who are real businesses at a fraction of the cost they would otherwise have to incur. Our problem with the company is twofold:
- It increasingly seems that dropshippers and other types of “fake” customers are abusing its business model, while the company seems to be supporting this instead of coming in clean and trying to prevent it.
- It is valued to an unrealistic scenario of swift eternal expansion and perfect execution, while still being loss making since 2012 albeit processing gross merchandize value of $41.1 billion in 2018.
As already stated, we believe the most likely scenario to be the eventual loss of investor confidence and the resulting massive collapse of the stock price, with bankruptcy out of the picture for the time being.
Valuation model
We believe a simple two – stage DCF based on assuming the GMV and revenue growth, CFO margin, terminal growth rate, and cost of capital would be sufficient to accurately demonstrate the market implied scenario and then provide us with a conservative target price.
We will first do a reverse valuation to see what kind of assumptions are implied by the market, do a sanity check on those, and then do an estimation of the company’s value based on our own set of assumptions. That, to our minds, is an easier and more effective way of getting the whole picture right and spot obvious market overestimations, this being a case for a short position.
Market implied assumptions and valuation
In order to arrive at a valuation of the company at approx. 320$/share, an insignificant deviation from the current market price, we had to assume the following on the revenue side over the next 11 years:
Exhibit 5

*All applicable data from company’s financial statements and Bloomberg
The GMV should grow at 28% p.a. and arrive at $600 billion, increasing 15 times. GMV take rate should also increase twofold from current 1.5% to 3%, resulting in revenues from merchant solutions growing at 36% p.a. and reaching $18 billion, an increase of 30 times vs 2018.
The number of merchants under subscription should grow at 23% p.a. reaching circa 8 million, resulting in subscription revenues growing at 24% p.a. and reaching $ 4.7 billion, a 10 time increase vs 2018.
Total revenues should grow at 32% p.a. reaching $22.7 billion, a 21 times increase vs 2018. We had to assume the MRR margin stays roughly the same at 8.3% of subscription revenue.
The share of subscription revenue would decrease 2 times from a current level of 43.3%, as growth of revenues from merchant solutions significantly outpaces that of subscription revenue.
On the margins, cash flow, and growth rate side we had to assume the following by year 11:
Exhibit 7
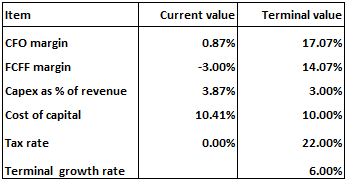
*All applicable data from company’s financial statements and Bloomberg
The CFO margin starts at an actual unadjusted level of circa 1% and grows to 17% by year 11, with real cash flows from operations replacing current inflators, such as stock-based compensation. The FCFF margin starts at current negative level and eventually flattens at 14% by year 11.
CAPEX starts at an actual level of 4% of revenues and eventually flattens at 3% by year 10. The annual terminal growth rate had to be assumed at 6%.
The cost of capital starts at an actual level of 10.4% and flattens at 10%. The tax rate starts at 0% and eventually flattens at an average applicable corporate level of 22%.
Our own assumptions and valuation
In order to obtain a conservative price target, we did a valuation on set of assumptions that seem to us as being unattainable for a number of reasons outlined in the summary and the conclusion sections. We believe that the resulting numbers justify opening a fundamentally sound short position.
Exhibit 10

*All applicable data from company’s financial statements and Bloomberg
The GMV would grow at 25% p.a. and arrive at $600 billion, increasing 12 times. GMV take rate would also increase from current 1.5% to 2%, resulting in revenues from merchant solutions growing at 28% p.a. and reaching $9.6 billion, an increase of over 15 times vs 2018.
The number of merchants under subscription would grow at 16% p.a. reaching circa 4 million, resulting in subscription revenues growing at 16% p.a. and reaching $ 2.4 billion, a five time increase vs 2018.
Total revenues would grow at 25% p.a. reaching $12 billion, an 11 times increase vs 2018. We assumed the MRR margin stays roughly the same at 8.3% of subscription revenue.
The share of subscription revenue would decrease 2 times from a current level of 43.3%, as growth of revenues from merchant solutions significantly outpaces that of subscription revenue.
On the margins, cash flow, and growth rate side we have assumed the following by year 11:
Exhibit 12
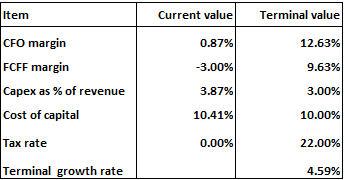
*All applicable data from company’s financial statements and Bloomberg
The CFO margin starts at an actual unadjusted level of circa 1% and grows to 13% by year 11, with real cash flows from operations replacing current inflators, such as stock-based compensation. The FCFF margin starts at current negative level and eventually flattens at 10% by year 11.
CAPEX starts at an actual level of 4% of revenues and eventually flattens at 3% by year 10. We assumed the annual terminal growth rate to be at 4.6%.
The cost of capital starts at an actual level of 10.4% and flattens at 10%. The tax rate starts at 0% and eventually flattens at an average applicable corporate level of 22%.
The above model results in an estimated target price of circa 111$, 65% below current market price.
Conclusion
We truly believe Shopify is a company initially built around a spectacular idea of offering a unique value proposition to its customers. It is however, our view that the company has strayed from that noble goal by condoning and capitalizing on abusive practices of a certain predatory group of its customers.
While not directly breaking any laws that we know of, this reeks of bad business practices and artificial inflation of market valuation. The company’s management should address the opacity of its regulatory filings and release a detailed breakdown of its customer base with a number of simple but informative metrics, as is the custom in the industry.
It is our firm belief that once (if ever) they do that, investors will realize that their revenues are mostly generated by a fast rotating cohort of dropshippers and other types of intermediaries that should not exist in our modern digital age with its free flow of information. An obvious reaction to that realization would be the total collapse of Shopify’s market cap and a prolonged distrust period.
Provided they survive the above scenario and manage to clean up their act by implementing certain customer filtering practices, the company might take its rightful place amongst competition, which is by any means formidable. We then estimate it to be, at best, an average business in a highly competitive environment, growing at industry averages, of no particular interest to value or GARP investors.
There are a number of facts supporting the argument that Shopify is hugely overpriced even if one chooses to ignore its questionable marketing practices and the quality of its revenue streams:
- The company is valued multiple times above its peers and the general SaaS industry, which is on itself by no means cheap.
- It is loss making, its gross margins are shrinking, growth is slowing, marketing expenses are losing efficiency, and competition is heating up. It should always be remembered that it took Shopify circa 15 years to get where it is, still struggling.
- A number of large emblematic customers that the management loves to showcase (Nike, Budweiser, etc) are, by nature of their business, provider – agnostic, and would immediately switch to a competitor should they offer better terms. It should also be noted that they do not sign any exclusivity agreements, and may find it best to use a number of competing platforms simultaneously.
We therefore believe our target price of 110$ is a safe bet on that “reality check” moment by the market, and we advise anyone holding a short position be ready to withstand significant interim upside volatility, as there is no way of knowing when that moment would come.
Potential risks to the position
We see the main risk to be the established optimistic market consensus continuing for a prolonged period, carrying the price significantly higher.
The management might come out of the closet on questions we and other researchers ask and provide a clear explanation on key metrics of the company’s customer base. There is a good deal of chance those answers will shatter our arguments on dropshipping and artificial traffic inflation being major revenue drivers, and that would most definitely explode the stock upwards, albeit still won’t change the overvaluation thesis.
There might even be a merger or a buyout with something like 30 – 50% premium to the then current market price.
Related research
When preparing this report we came across a number of solid researches by Jan Barta of the Absurd Research, in which he described in detail his findings on Shopify hosted websites’ traffic, estimated the churn rate, and laid out a clever but simple model to estimate the adjusted annual dollar retention rate. The link to the reports are below:
https://seekingalpha.com/article/4188024-shopifys-new-merchant-quality-significantly-deteriorating
*********
The author Dmitrijs Soha is head of Asset Management at Pinnacle Global Alpha, a small team with a deep fundamental long/short equity approach. He can be reached at dsoha@pinnacleglobal.net for a more detailed version of the report or any feedback.

Leave a Reply