
Contributed by Kevin Bush, CFA, CMT and Bhavana Khanna, PhD of KBK Capital Management.
The original “VIX” is the ticker symbol for the Chicago Board Options Exchange (CBOE) Volatility Index, which shows the market’s expectation of 30-day volatility. It is constructed using the implied volatilities of a wide range of S&P 500 index options. This volatility is meant to be forward looking, is calculated from both calls and puts, and is a widely used measure of market risk, often referred to as the “investor fear gauge.” The higher the VIX reading, the more expected volatility, i.e. the greater the fear. Since its introduction, similar “VIXs” have been created to measure a wide range of expected volatility across many markets.
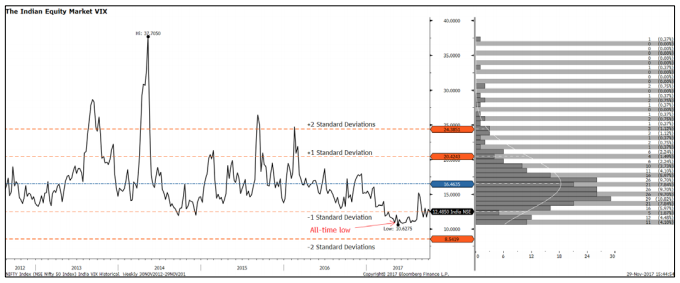
INVIXN is the ticker symbol for the Indian equity market’s VIX calculation and is based on Nifty 50 Index Option prices. Like the original VIX, low levels indicate investors expect little volatility over the next 30 days. Market strategists typically use the VIX as a contrarian sentiment measure when it approaches extremes. If everyone is calm, then tiny amounts of unwelcome news can quickly result in bursts of volatility and poor market performance. Likewise, if the VIX spikes to extreme highs, it suggests fear has overtaken the market and leaves it very susceptible to positive surprises and market recoveries. Earlier this year on May 14, the INVIXN recorded its lowest reading in its nearly ten-year history. As dedicated India investors, this got our attention.
Below we show the Indian VIX with standard deviation bands and its weekly distribution over the past five years. One thing that quickly stands out, other than the VIX presently being at low levels, is the skewness of the distribution. This results from the VIX having a lower bound of 0 and no upper bound, as well as, the fact that fear tends to grip markets in sudden burst of panic; whereas, complacency evolves more slowly. Do this skewness, even an all-time low reading will not breach the two-standard deviation level on the side of the distribution that is not skewed, i.e. extremely low levels.
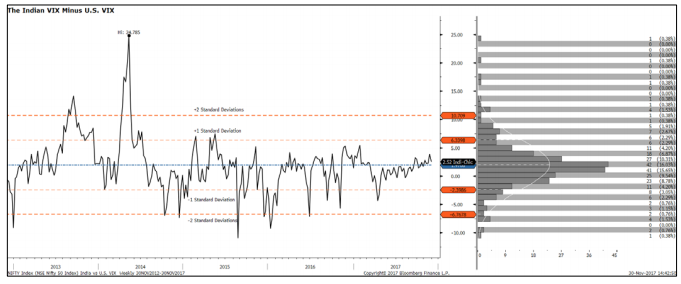
Next, we want to determine if the level of India’s VIX, relative to its historical relationship with other markets, is near an all-time low. In other words, is the Indian VIX trading at a premium or discount to its historical relative level compared to other markets? In particular, we are interested in the Indian VIX’s level in relation to the S&P 500’s VIX level because the U.S. equity market represents a large competitor for investors’ assets. Below we show the same type of chart with the only difference being that we are plotting the difference between the Indian VIX and U.S. VIX. Here, we see that over the past five years, the India VIX has traded, on average, about two points higher than the U.S. VIX. Presently, the Indian VIX is about 2.4 points higher. This suggest slightly less relative complacency in the Indian equity market compared to the U.S. market. For all practical purposes, it is at normal levels though.
Since the May 14 all-time low in the Indian VIX, it has increased as much as 5 points and now appears to be in a rising trend. (See chart on page 1) Yet, the Indian equity market has reached new highs during this time. To be sure, often after sustained low VIX readings, markets decline as the VIX rises, as has occurred times prior for the Indian market. Will this time turn out different, and if so, why?
Financial markets are extremely complex mechanisms, and at any given time, various forces are operating on asset prices to varying degrees. Some of the many forces include changes in economic growth, inflation, interest rates, earnings, valuation, consumer confidence, liquidity conditions, fiscal policy, investor psychology and sentiment. It is tempting for novice and professional investors alike to grab onto one or two data points and focus on them in isolation and extrapolate past results into the future without taking in the current context into account. That is why our investment process is designed to force us to review major market drivers in context to each other on a regular basis.
The all-time low VIX reading has warned us that sentiment levels could be flashing warning signs. Sentiment is an important input because it is one of the few factors that lead stock market returns, which are leading indicators themselves of the real economy. “Leading-leading” indicators with reasonable predictive value are few and far between. Sentiment is one of them.
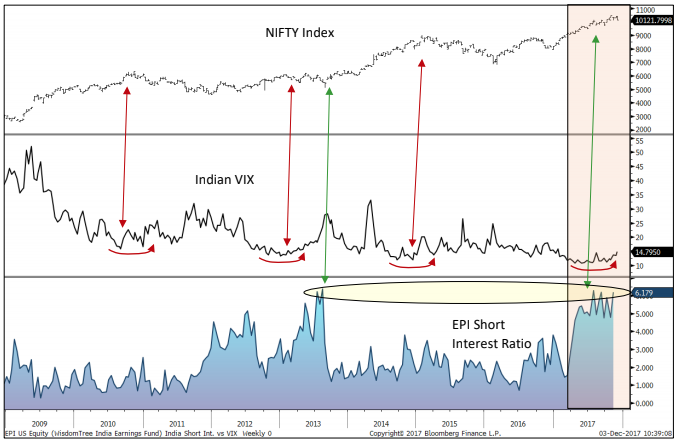
Fortunately for Indian equity markets, while the VIX has been flashing red, other sentiment measures stand in contrast to the VIX warning. For example, unlike during previous low VIX readings, the short interest ratio in the U.S. Wisdom Tree India Earnings ETF (EPI), the largest Indian ETF with short interest data available, has been near an all-time high since May 14. Apparently, U.S. traders continue to wait for a correction in the Indian equity market.
High short-interest in a broad market-related investment vehicle is not consistent with universal positive sentiment. The last time EPI’s short interest was at these levels a short squeeze took place alongside a NIFTY rally. We do not know if that will happen this time, however, what is important from a strategy perspective, is that the current low VIX reading in India is in a different overall sentiment context than during previous junctures. This argues there may be less downside risk than during previous occasions so long as short interest remains near record highs in EPI.
EPI’s short interest has only been above 5% of the shares outstanding 6% of the time since the ETF was launched in February of 2008. The traders presently shorting EPI have been patient. Why are they short? No one can know for sure, but because short positions are short-term in nature and cost money to carry, it is probably not due to valuation concerns, which play out over long periods of time. The fact that short interest rocketed higher when the Indian VIX hit an all-time low probably has something to do with it. Shorting EPI at similar low-VIX junctures in the past appears to have been a winning short-term strategy. Perhaps classic herd mentality, or the “all hedge funds put on the same trades” problem has appeared in this situation.
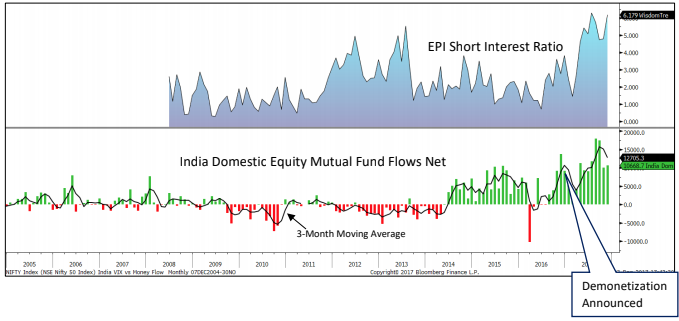
India, like every market, has its own unique dynamics and factors driving its performance. We have a view as to one reason why the Indian market has remained resilient in the face of a low and rising VIX and short bets building-up in ETFs at the present occasion. On November 8, 2016, Prime Minister of India Narendra Modi announced the demonetization in an unscheduled live televised address to the nation. The goal was to curtail the shadow economy and crack down on the use of illicit and counterfeit cash to fund illegal activity and terrorism. Cash in circulation plummeted from about 18 trillion INR to 8 trillion in just a few months and caused widespread economic disruption.
Since then, cash in circulation has recovered to about 16 trillion. Deposits in Indian banks have surged since demonetization. For the past six months, some of this newly accounted for money has been finding its way into the stock market. Domestic money flows into stock mutual funds were at elevated levels before demonetization. After the initial disruption, they have been surging to all-time highs. This has provided an unexpected exogenous shock to the demand for equities within India due to a structural change in the economy.
We do not know if this newfound domestic demand for Indian equities is permanent, but it has played a role in Indian market dynamics since demonetization and should be considered when formulating strategy for the Indian markets. It certainly has the possibility to be changing current market dynamics from what they would be otherwise. Indian demonetization also serves as a good example of something that has made the investing landscape different than it was in the past. Going forward, we will continue to monitor structural changes akin to demonetization that might have the effect of changing past market dynamics.
Conclusion
Low levels of implied volatility often proceed poor market performance. As dedicated India investors, we want to be aware of what risk the Indian equity market faces with its current low VIX reading. We have concluded that low expected volatility, or high levels of “investor complacency”, is generally a problem on a global basis, not just in India. Indian markets do not appear to be “extra” complacent when compared to many other countries’ markets, rather, India’s VIX is near normal relative levels versus many other countries’ VIXs.
The VIX is just one measure of sentiment. In India’s case, other measures of investor sentiment, such as short-interest in a major Indian ETF, are not confirming investor complacency. In fact, it is demonstrating just the opposite; there is a very high level of bets being placed on a decline in Indian markets. A structural change in India’s economy has resulted from the unexpected demonetization policy announced on November 8, 2016. A large amount of money previously not accounted for is now held in financial institutions. There is evidence that some of this newly institutionalized money is finding its way into the Indian stock market. Record inflows of domestic money into domestic mutual funds in India may be one reason the Indian stock market has remained so resilient over the past six months.
KBK India Opportunity Fund Ramifications
A major component included in the KBK India Opportunity Fund’s investment process is risk management. The fund has a specific risk-budget that is tied to broad emerging market volatility. Specifically, we do not allow the fund’s downside volatility to exceed that of the MSCI Emerging Markets Index*. We utilize futures contracts to hedge risk when appropriate. Our hedging process specifically takes into account current levels of investor sentiment, with the VIX being an important input. Our current review of the low levels of the Indian VIX suggest to us that the downside risk typically indicated by a low VIX reading in the Indian equity market is not as great at the current juncture as compared with times in the past. This is due to “overly optimistic” sentiment readings not being confirmed across other measures of sentiment for the Indian equity market, as well as, a structural change in the economy that has recently resulted in increased domestic fund flows.

Leave a Reply